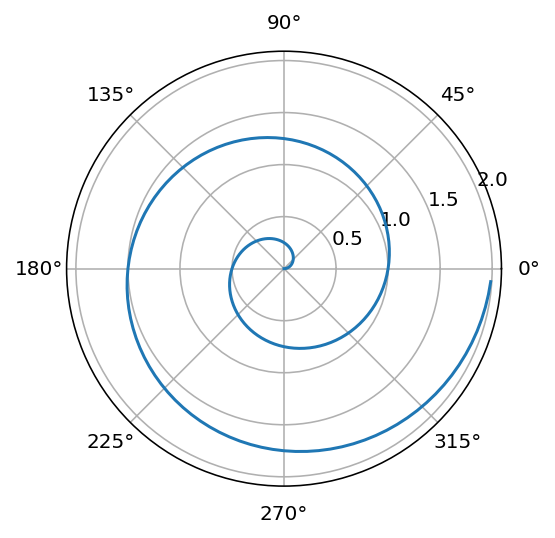
import numpy as np
import matplotlib.pyplot as plt

r = np.arange(0, 2, 0.01)
theta = 2 * np.pi * r
fig, ax = plt.subplots(
  subplot_kw = {'projection': 'polar'}
)
ax.plot(theta, r)
ax.set_rticks([0.5, 1, 1.5, 2])
ax.grid(True)
plt.show()
Lucas A. Meyer
June 10, 2022
I thought moving from Jekyll to Quarto was going to be hard. It was not.
For a long time, I had an unfulfilled wish list for a blog platform:
A large number of platforms fulfills the first two items, but I struggled to find one that fulfilled the last item. I finally found Pelican, but I found it too clunky and started to worry that it was not going to be maintained for long. Therefore, I oscillated between Jekyll and Hugo (using blogdown) for a long time. I liked blogdown a lot, but whenever I’m switching a lot between R and Python, my brain gets really unhappy.
Recently, I found Quarto that ticks all my boxes and solves a lot of other problems. My feeling when using Quarto must be similar to the feeling of Python programmers when they started using Jupyter (because they never used RStudio) or similar to what I felt when, as an analyst, started using RStudio. Things just work.
When I was initially switching between Jekyll and Hugo, one of the most annoying things was Jekyll preferred posts as files, while blogdown preferred posts as directories. RStudio even provides a function bundle_site() to convert files to directories. Now, when I’m converting to Quarto, I thought I needed to write such a function in Python.
Again, it turns out that “things just work”. Quarto accepts both directores and files as posts and rendered everything correctly. So I’m going to draw the “Quarto Spiral” instead, just to celebrate!